0047. 使用 ctx.transform 来转换图形
1. 📝 简介
ctx.transform 很强大,可以实现很多转换效果,难点在于计算坐标的转换规则。
2. 🔗 links
- https://developer.mozilla.org/en-US/docs/Web/API/CanvasRenderingContext2D/transform - MDN - CanvasRenderingContext2D:transform() 方法
3. 📒 notes
ctx.transform 很强大,可以实现很多转换效果。但是这玩意儿的参数值需要根据具体的转换效果来挨个计算。
3.1. ctx.transform 坐标转换计算规则
这部分介绍有关 ctx.transform 坐标转换的计算规则。
重点需要理解文中提到的公式,需要知道 (x, y) 是如何计算出来的。
ctx.transform 方法用于修改画布的当前变换矩阵。它执行一个矩阵乘法来应用一个变换,这个变换可以包括旋转、缩放、移动(平移)以及倾斜(错切)等操作。
使用 transform() 方法可以非常灵活地对图形进行多种变换操作,是高级图形处理中非常有用的工具。
ctx.transform(a, b, c, d, e, f) 这里的参数对应于变换矩阵的组成部分,具体如下:
- a (m11): 水平缩放绘图
- b (m12): 水平倾斜绘图
- c (m21): 垂直倾斜绘图
- d (m22): 垂直缩放绘图
- e (dx): 水平移动绘图
- f (dy): 垂直移动绘图
所谓的变换就是将原坐标按照一定的变换公式(逻辑),变换成一个新坐标。
转换公式:
在公式中,我们知道的值是图形的当前坐标 (x, y),其中 a~f 是我们传递的参数。
累积效应:
transform() 方法会与当前变换矩阵相乘,因此它的效果是累积的。
如果要重置变换矩阵到默认状态,可以使用 ctx.setTransform(1, 0, 0, 1, 0, 0)。将 a、d 置 1,其他值都置 0,也就是说 x = x`` y = y``。
区别于 setTransform():
setTransform() 也用于设置变换矩阵,但它会重置当前的变换矩阵再设置新的矩阵,而不是累积应用。
4. 💻 demo1
html
<!-- 1.html -->
<!DOCTYPE html>
<html lang="en">
  <head>
    <meta charset="UTF-8" />
    <meta http-equiv="X-UA-Compatible" content="IE=edge" />
    <meta name="viewport" content="width=device-width, initial-scale=1.0" />
    <title>Document</title>
  </head>
  <body>
    <script src="./drawGrid.js"></script>
    <script>
      const canvas = document.createElement('canvas')
      drawGrid(canvas, 500, 500, 50)
      document.body.append(canvas)
      const ctx = canvas.getContext('2d')

      ctx.beginPath()
      // 原始矩形
      ctx.fillStyle = 'blue'
      ctx.fillRect(50, 50, 100, 50)

      ctx.transform(1, 0, 0, 1, 100, 100)
      // 表示横纵各移动 100

      ctx.fillStyle = 'red'
      ctx.fillRect(50, 50, 100, 50)
    </script>
  </body>
</html>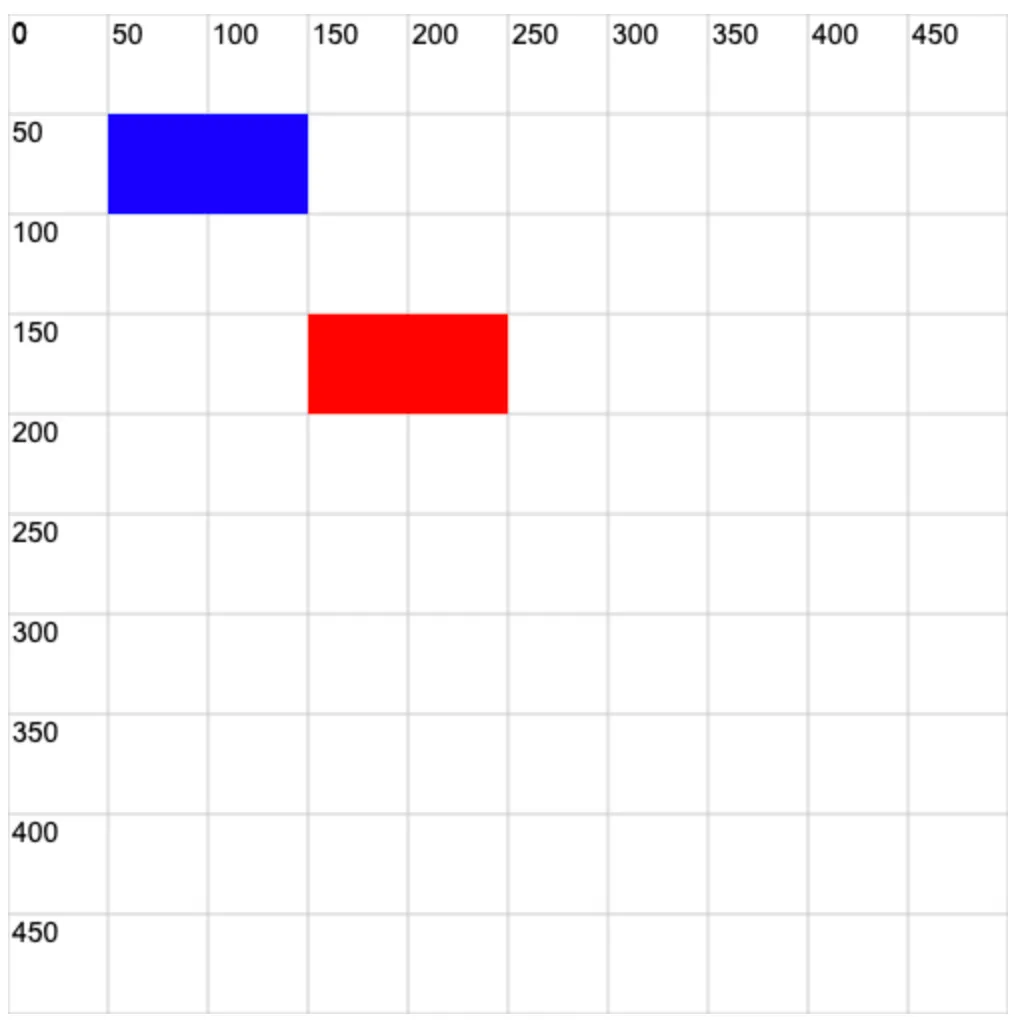
5. 💻 demo2
html
<!-- 2.html -->
<!DOCTYPE html>
<html lang="en">
  <head>
    <meta charset="UTF-8" />
    <meta http-equiv="X-UA-Compatible" content="IE=edge" />
    <meta name="viewport" content="width=device-width, initial-scale=1.0" />
    <title>Document</title>
  </head>
  <body>
    <script src="./drawGrid.js"></script>
    <script>
      const canvas = document.createElement('canvas')
      drawGrid(canvas, 500, 200, 50)
      document.body.append(canvas)
      const ctx = canvas.getContext('2d')

      ctx.beginPath()
      // 原始矩形
      ctx.fillStyle = 'blue'
      ctx.fillRect(100, 100, 100, 50)
      // 从 x 为 100,y 为 100 的位置开始
      // 画一个横向长度为 100 纵向长度为 50 的矩形

      ctx.transform(2, 0, 0, 0.5, 0, 0)
      // 表示横向放大 2 倍,纵向缩小 0.5 倍。

      ctx.fillStyle = 'red'
      ctx.fillRect(100, 100, 100, 50)
      // 从 x 为 2 * 100,y 为 0.5 * 100 的位置开始
      // 画一个横向长度为 2 * 100 纵向长度为 0.5 * 50 的矩形
    </script>
  </body>
</html>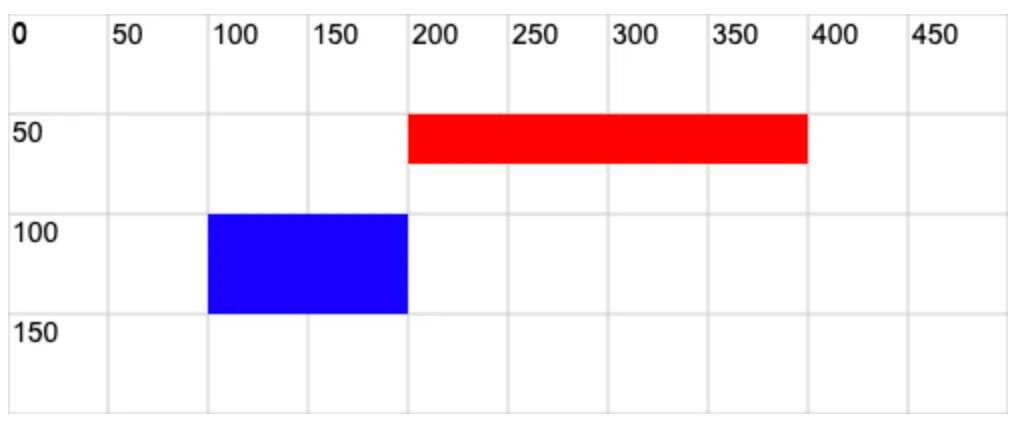
6. 💻 demo3
html
<!-- 3.html -->
<!DOCTYPE html>
<html lang="en">
  <head>
    <meta charset="UTF-8" />
    <meta http-equiv="X-UA-Compatible" content="IE=edge" />
    <meta name="viewport" content="width=device-width, initial-scale=1.0" />
    <title>Document</title>
  </head>
  <body>
    <script src="./drawGrid.js"></script>
    <script>
      const canvas = document.createElement('canvas')
      drawGrid(canvas, 500, 200, 50)
      document.body.append(canvas)
      const ctx = canvas.getContext('2d')

      ctx.beginPath()
      ctx.globalAlpha = 0.8

      ctx.fillStyle = 'blue'
      ctx.fillRect(100, 100, 100, 50)

      ctx.transform(1, 0, Math.tan((30 * Math.PI) / 180), 1, 0, 0)
      // 实现倾斜效果

      ctx.fillStyle = 'red'
      ctx.fillRect(100, 100, 100, 50)
    </script>
  </body>
</html>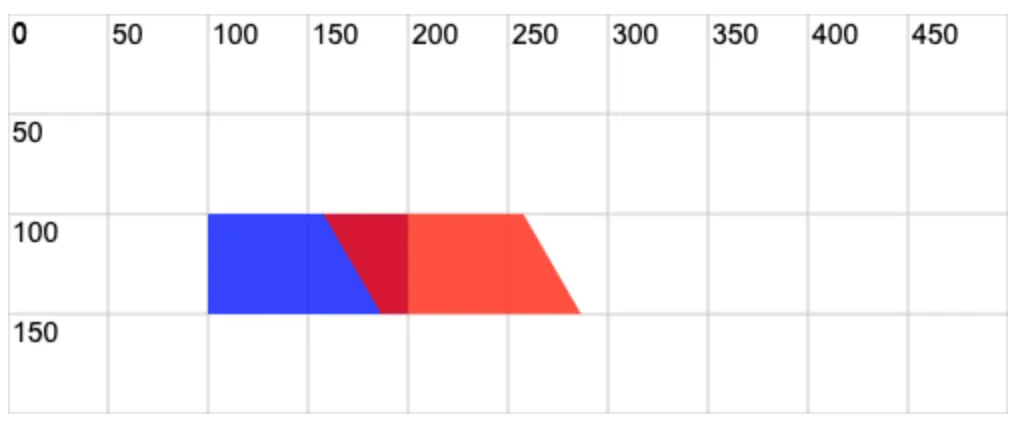
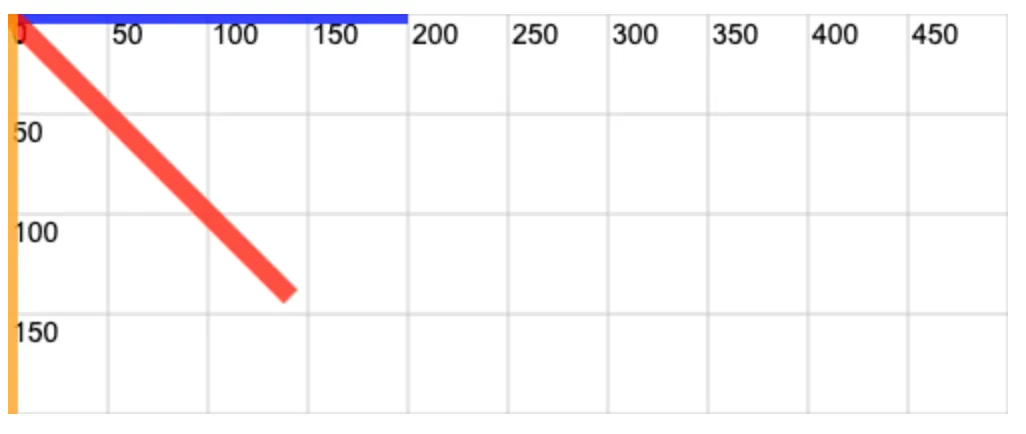
7. 💻 demo4
html
<!-- 4.html -->
<!DOCTYPE html>
<html lang="en">
  <head>
    <meta charset="UTF-8" />
    <meta http-equiv="X-UA-Compatible" content="IE=edge" />
    <meta name="viewport" content="width=device-width, initial-scale=1.0" />
    <title>Document</title>
  </head>
  <body>
    <script src="./drawGrid.js"></script>
    <script>
      const canvas = document.createElement('canvas')
      drawGrid(canvas, 500, 200, 50)
      document.body.append(canvas)
      const ctx = canvas.getContext('2d')

      ctx.globalAlpha = 0.8
      ctx.lineWidth = 10

      ctx.beginPath()
      ctx.strokeStyle = 'blue'
      ctx.moveTo(0, 0)
      ctx.lineTo(200, 0)
      ctx.stroke()

      ctx.transform(
        Math.cos((45 * Math.PI) / 180), // a
        Math.sin((45 * Math.PI) / 180), // b
        -Math.sin((45 * Math.PI) / 180), // c
        Math.cos((45 * Math.PI) / 180), // d
        0, // e
        0 // f
      )
      // 实现旋转效果 旋转角度 45°

      ctx.beginPath()
      ctx.strokeStyle = 'red'
      ctx.moveTo(0, 0)
      ctx.lineTo(200, 0)
      ctx.stroke()

      ctx.transform(
        Math.cos((45 * Math.PI) / 180), // a
        Math.sin((45 * Math.PI) / 180), // b
        -Math.sin((45 * Math.PI) / 180), // c
        Math.cos((45 * Math.PI) / 180), // d
        0, // e
        0 // f
      )
      // 实现旋转效果 旋转角度 45°
      // 每次变化都是基于之前的效果累加
      // 这次是第二次旋转 45°,相当于一共旋转了 90°。

      ctx.beginPath()
      ctx.strokeStyle = 'orange'
      ctx.moveTo(0, 0)
      ctx.lineTo(200, 0)
      ctx.stroke()
    </script>
  </body>
</html>