0021. 使用 ctx.rect 绘制矩形
1. 📝 简介
- 学会使用
ctx.rect()来绘制一个填充路径。
2. 💻 demo1
html
<!-- 1.html -->
<!DOCTYPE html>
<html lang="en">
<head>
<meta charset="UTF-8" />
<meta name="viewport" content="width=device-width, initial-scale=1.0" />
<title>Document</title>
</head>
<body>
<script src="./drawGrid.js"></script>
<script>
const cavnas = document.createElement('canvas')
drawGrid(cavnas, 500, 500, 50)
document.body.appendChild(cavnas)
const ctx = cavnas.getContext('2d')
ctx.beginPath()
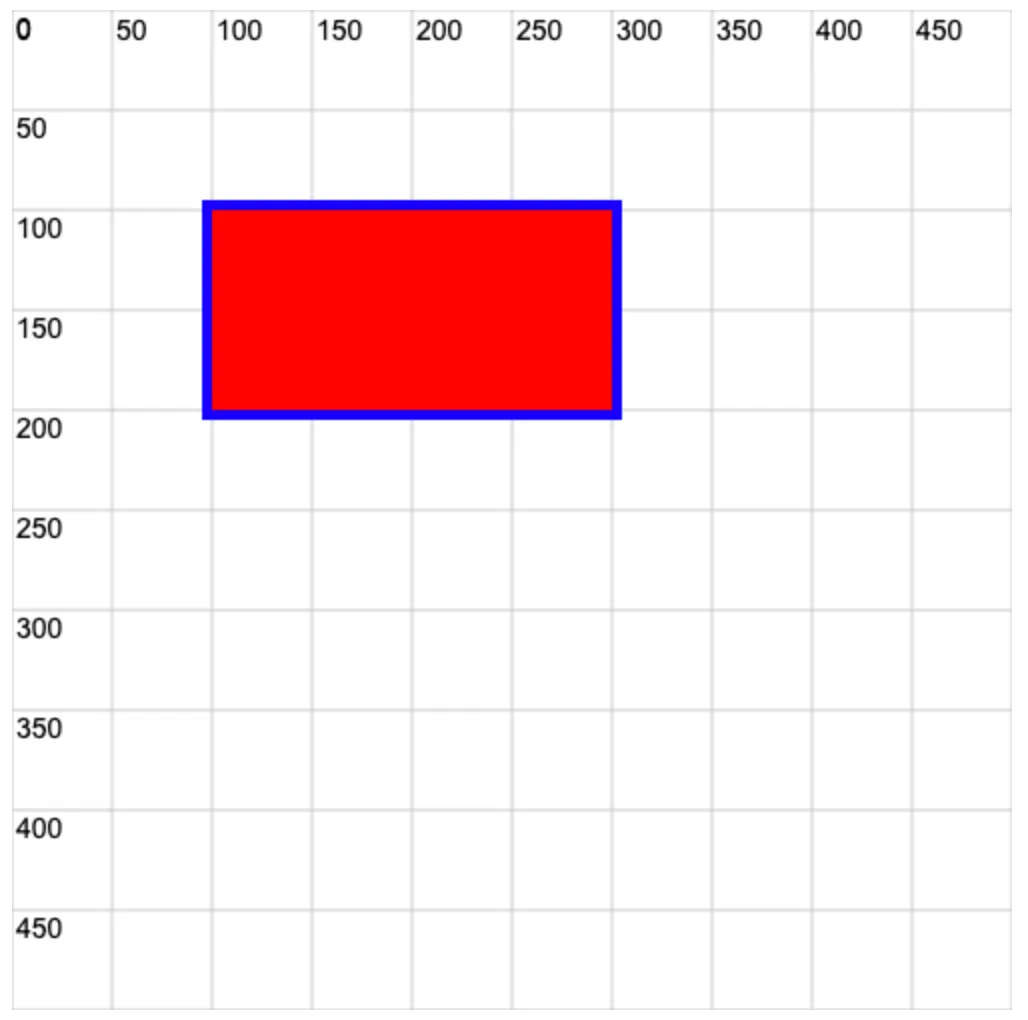
ctx.rect(100, 100, 200, 100) // 设置一个矩形路径
ctx.fillStyle = 'red' // 设置填充颜色
ctx.strokeStyle = 'blue' // 设置画笔颜色
ctx.lineWidth = 10 // 设置画笔宽度
ctx.stroke() // 绘制矩形路径
ctx.fill() // 填充矩形
// 上述做法实际上是先准备好路径
// 然后再对路径进行填充和描边
// 注意:
// 代码执行到 ctx.fill() 位置意味着 canvas 本次绘制已经完毕了
// 若再去设置类似 ctx.fillStyle = 'blue' 等样式是不会生效的
</script>
</body>
</html>