0027. 使用 ctx.arcTo 绘制圆弧
1. 📝 简介
- 学会使用
ctx.arcTo绘制圆弧。 **需要注意:**传入的参数并不决定绘制的线条的起点 or 终点,而仅仅是起到决定圆弧弧度的作用。ctx.arcTo绘制圆弧比较奇怪,你只需要通过控制点描述出一个角就行,它这玩意儿会根据你给定的角去绘制弧,最终绘制出来的弧的起点和终点,并不一定是从你的控制点开始的。
2. 💻 demo1
html
<!-- 1.html -->
<!DOCTYPE html>
<html lang="en">
  <head>
    <meta charset="UTF-8" />
    <meta name="viewport" content="width=device-width, initial-scale=1.0" />
    <title>📝 arcTo 方法</title>
  </head>
  <body>
    <script src="./drawGrid.js"></script>
    <script>
      const cavnas = document.createElement('canvas')
      drawGrid(cavnas, 500, 500, 50)
      document.body.appendChild(cavnas)
      const ctx = cavnas.getContext('2d')

      // #region 辅助线
      ctx.beginPath()
      ctx.moveTo(100, 100)
      ctx.lineTo(100, 300)
      ctx.lineTo(300, 300)
      ctx.stroke()

      ctx.beginPath()
      ctx.arc(200, 200, 100, 0, Math.PI * 2)
      ctx.stroke()
      // #endregion 辅助线

      // context.arcTo(x1, y1, x2, y2, radius)
      // 用于绘制圆角路径。
      // 常用于绘制具有特定半径的圆角。

      // 第 1 个点:moveTo 指定的点或者上一次图形路径结束的点
      // 第 2 个点:(x1, y1)
      // 第 3 个点:(x2, y2)
      // 由 3 个控制点实现圆弧的绘制。
      // 按照 3 个点的位置,连线,形成一个夹角。
      // 绘制的圆弧,与夹角的两条边相切。
      // 根据指定的半径的不同,绘制出来的圆弧也不同。

      // radius 指定了圆角的大小,即圆弧的半径。
      // 根据 r 绘制圆弧,保证与两个线条相切。
      // 注意:如果 radius 值过大,无法基于提供的点和半径绘制圆角,那么浏览器将不绘制圆弧。

      ctx.beginPath()
      ctx.lineWidth = 10
      ctx.strokeStyle = 'red'
      ctx.moveTo(100, 200) // 起点
      ctx.arcTo(100, 300, 200, 300, 100)
      // 100 300 表示第 1 个控制点
      // 200 300 表示第 2 个控制点
      // 100 表示圆角的半径
      ctx.stroke()
    </script>
  </body>
</html>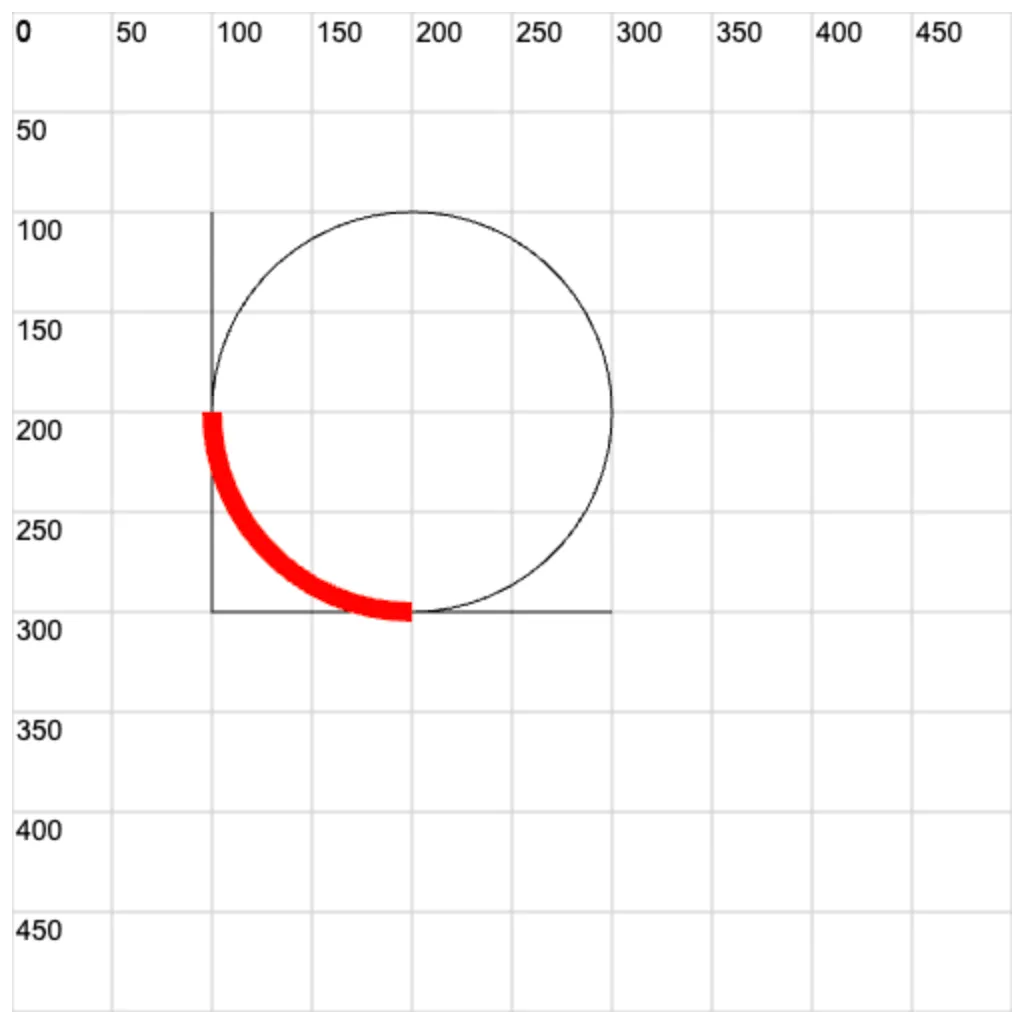
3. 💻 demo2
html
<!-- 2.html -->
<!DOCTYPE html>
<html lang="en">
  <head>
    <meta charset="UTF-8" />
    <meta name="viewport" content="width=device-width, initial-scale=1.0" />
    <title>📝 arcTo 方法</title>
  </head>
  <body>
    <script src="./drawGrid.js"></script>
    <script>
      const cavnas = document.createElement('canvas')
      drawGrid(cavnas, 500, 500, 50)
      document.body.appendChild(cavnas)
      const ctx = cavnas.getContext('2d')

      // #region 辅助线
      ctx.beginPath()
      ctx.moveTo(100, 100)
      ctx.lineTo(100, 300)
      ctx.lineTo(300, 300)
      ctx.stroke()

      ctx.beginPath()
      ctx.arc(200, 200, 100, 0, Math.PI * 2)
      ctx.stroke()
      // #endregion 辅助线

      ctx.beginPath()
      ctx.lineWidth = 10
      ctx.strokeStyle = 'red'
      ctx.moveTo(100, 100) // 起点坐标
      ctx.arcTo(100, 300, 300, 300, 50)
      // 100 300 表示第 1 个控制点
      // 300 300 表示第 2 个控制点
      // 50 表示圆角的半径
      // 注意:ctx.arcTo 这玩意儿绘制的是圆弧
      // 所以最终结束位置是在圆弧的终点,而非控制点 2 所在的位置。
      // 把控制点 2 的坐标由 300 300 改成 101 300 最终绘制的效果也是一样的。
      // ctx.arcTo(100, 300, 101, 300, 50)
      ctx.stroke()
    </script>
  </body>
</html>