0041. 使用 ctx.createLinearGradient 实现线性渐变效果
1. 📝 简介
createLinearGradient(x0, y0, x1, y1)它设置的仅仅是线性渐变的区域。
2. 🔗 links
- https://developer.mozilla.org/en-US/docs/Web/API/CanvasRenderingContext2D/createLinearGradient - MDN -
ctx.createLinearGradient。
3. 💻 demo1
html
<!-- 1.html -->
<!DOCTYPE html>
<html lang="en">
<head>
<meta charset="UTF-8" />
<meta http-equiv="X-UA-Compatible" content="IE=edge" />
<meta name="viewport" content="width=device-width, initial-scale=1.0" />
<title>Document</title>
<style>
canvas {
border: 1px solid #888;
margin-right: 5px;
}
</style>
</head>
<body>
<script src="./drawGrid.js"></script>
<script>
// ctx.createLinearGradient 方法是 Canvas API 中用于创建线性渐变对象的函数。
// 接受四个参数:x0, y0, x1, y1
// 分别代表渐变的起点 (x0, y0) 和终点 (x1, y1) 的坐标。
// 会按照两点的连线方向渐变。
// 可以是横向、纵向、斜向。
// 注意:
// 渐变的参考系是画布坐标系。
// 位置不会随着图形的变化而变化。
{
const canvas = document.createElement('canvas')
drawGrid(canvas, 500, 200, 50)
document.body.append(canvas)
const ctx = canvas.getContext('2d')
ctx.globalAlpha = 0.8
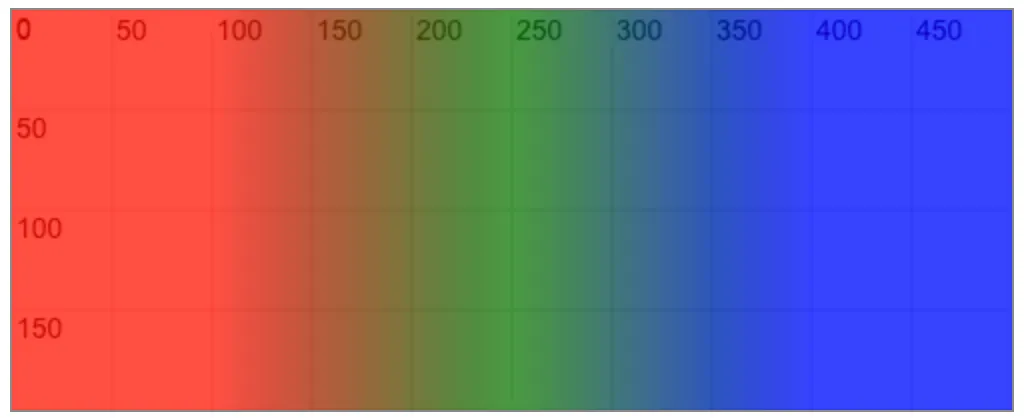
const gradient = ctx.createLinearGradient(0, 0, canvas.width, 0)
gradient.addColorStop(0, 'red') // 表示渐变的起点颜色为红色
gradient.addColorStop(0.5, 'green') // 表示渐变的中间(50% 位置)颜色为绿色
gradient.addColorStop(1, 'blue') // 表示渐变的终点颜色为蓝色
ctx.fillStyle = gradient
ctx.fillRect(0, 0, canvas.width, canvas.height)
}
// 仅修改矩形的尺寸和位置观察渐变效果。
// 会发现渐变是固定的,矩形位置和尺寸仅仅决定了展示哪一部分的渐变效果。
{
const canvas = document.createElement('canvas')
drawGrid(canvas, 500, 200, 50)
document.body.append(canvas)
const ctx = canvas.getContext('2d')
ctx.globalAlpha = 0.8
const gradient = ctx.createLinearGradient(0, 0, canvas.width, 0)
gradient.addColorStop(0, 'red')
gradient.addColorStop(0.5, 'green')
gradient.addColorStop(1, 'blue')
ctx.fillStyle = gradient
ctx.fillRect(200, 0, 100, canvas.height)
}
{
const canvas = document.createElement('canvas')
drawGrid(canvas, 500, 200, 50)
document.body.append(canvas)
const ctx = canvas.getContext('2d')
ctx.globalAlpha = 0.8
const gradient = ctx.createLinearGradient(0, 0, canvas.width, 0)
gradient.addColorStop(0, 'red')
gradient.addColorStop(0.5, 'green')
gradient.addColorStop(1, 'blue')
ctx.fillStyle = gradient
ctx.fillRect(400, 0, 100, canvas.height)
}
</script>
</body>
</html>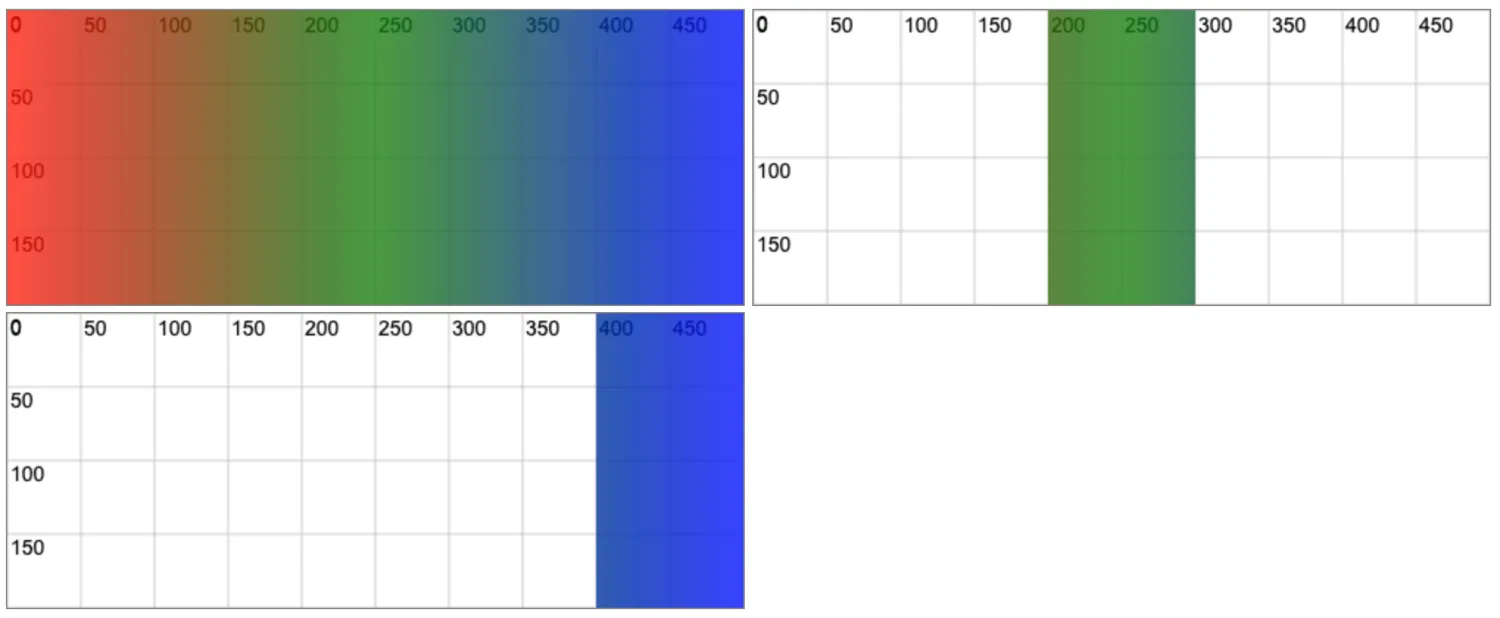
4. 💻 demo2
html
<!-- 2.html -->
<!DOCTYPE html>
<html lang="en">
  <head>
    <meta charset="UTF-8" />
    <meta http-equiv="X-UA-Compatible" content="IE=edge" />
    <meta name="viewport" content="width=device-width, initial-scale=1.0" />
    <title>Document</title>
  </head>
  <body>
    <script src="./drawGrid.js"></script>
    <script>
      // 前面的示例创建的是一个铺满整个 canvas 的渐变效果。
      // 如果渐变区域小于矩形区域的话,那么非渐变区域,将展示渐变的“终点”颜色。
      const canvas = document.createElement('canvas')
      drawGrid(canvas, 500, 200, 50)
      document.body.append(canvas)
      const ctx = canvas.getContext('2d')

      ctx.globalAlpha = 0.8

      // 渐变区域是从 100-400
      const gradient = ctx.createLinearGradient(100, 0, 400, 0)
      gradient.addColorStop(0, 'red')
      gradient.addColorStop(0.5, 'green')
      gradient.addColorStop(1, 'blue')

      // 绘制的矩形是从 0-500
      ctx.fillStyle = gradient
      ctx.fillRect(0, 0, canvas.width, canvas.height)

      // 仔细观察最终效果,会发现 0-100 和 400-500 的区域是渐变的“终点”颜色。
      // 这部分是没有渐变效果的。
    </script>
  </body>
</html>