0018. 使用 ctx.fillRect 绘制矩形
1. 📝 简介
- 学会使用
ctx.fillRect()来绘制一个填充矩形。
2. 📒 notes
ctx.fillRect(x, y, width, height)
(x, y)表示从哪个点开始绘制;width, height表示绘制的矩形的尺寸;
顾名思义,这玩意儿绘制的是一个填充矩形。当你没有指定填充样式 ctx.fillStyle 的时候,默认将会绘制一个黑色的填充矩形。
3. 💻 demo1 - 绘制一个默认的黑色填充矩形
html
<!-- 1.html -->
<!DOCTYPE html>
<html lang="en">
  <head>
    <meta charset="UTF-8" />
    <meta name="viewport" content="width=device-width, initial-scale=1.0" />
    <title>Document</title>
  </head>
  <body>
    <script src="./drawGrid.js"></script>
    <script>
      const cavnas = document.createElement('canvas')
      drawGrid(cavnas, 500, 500, 50)
      document.body.appendChild(cavnas)
      const ctx = cavnas.getContext('2d')
      ctx.beginPath()

      ctx.fillRect(100, 100, 200, 100)
      // 100 100 表示矩形左上角的 x y 坐标
      // 200 100 表示矩形的宽高
      // 该方法绘制的是一个填充矩形
      // 填充的颜色默认为黑色
    </script>
  </body>
</html>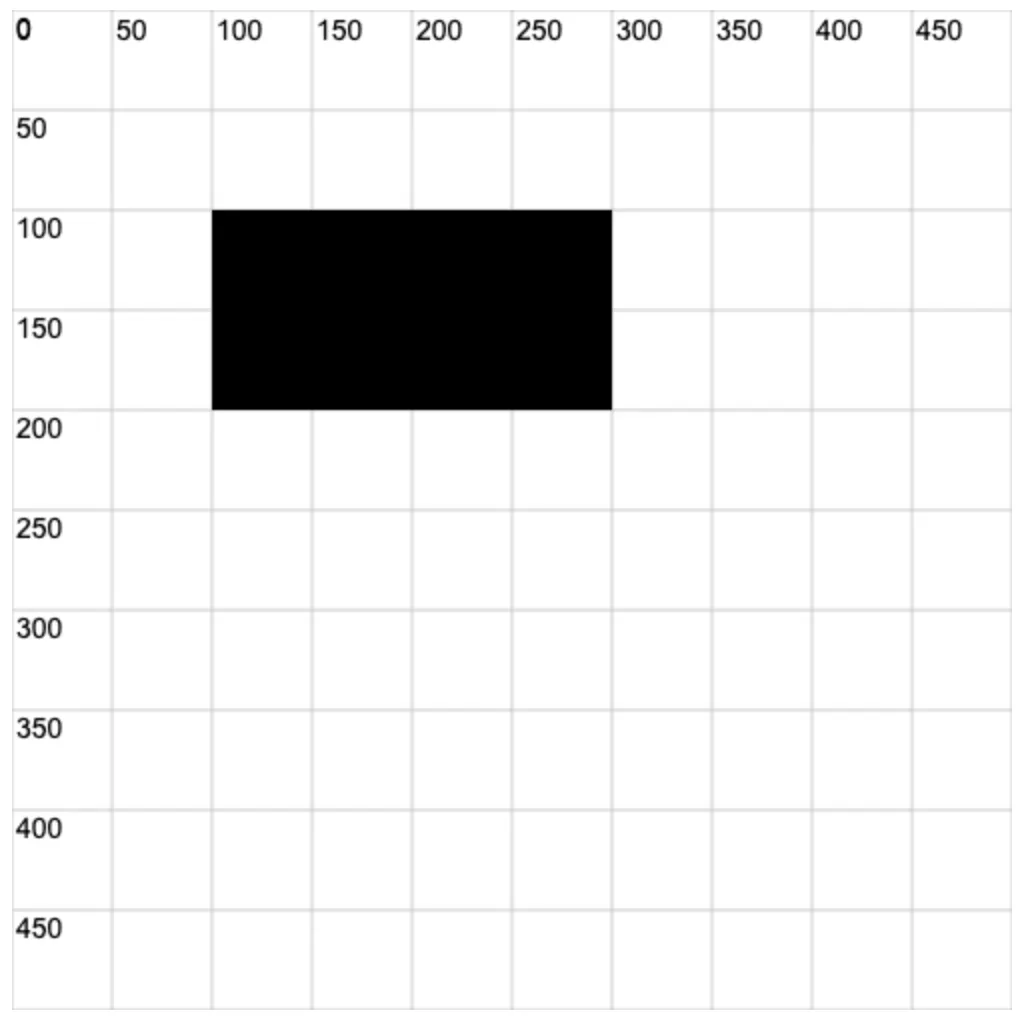
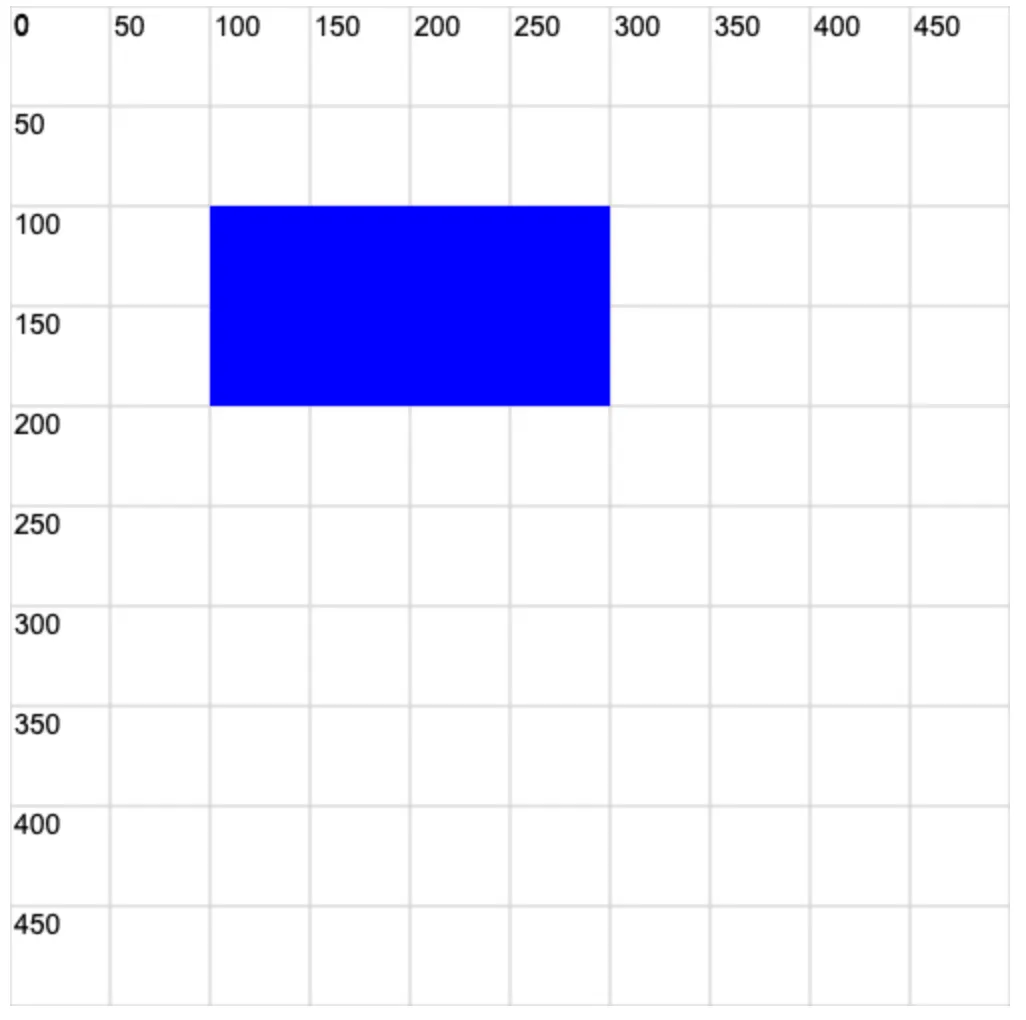
4. 💻 demo2 - 指定绘制矩形的颜色
html
<!-- 2.html -->
<!DOCTYPE html>
<html lang="en">
  <head>
    <meta charset="UTF-8" />
    <meta name="viewport" content="width=device-width, initial-scale=1.0" />
    <title>Document</title>
  </head>
  <body>
    <script src="./drawGrid.js"></script>
    <script>
      const cavnas = document.createElement('canvas')
      drawGrid(cavnas, 500, 500, 50)
      document.body.appendChild(cavnas)
      const ctx = cavnas.getContext('2d')
      ctx.beginPath()

      // 指定绘制的矩形的填充颜色为蓝色
      ctx.fillStyle = 'blue'

      ctx.fillRect(100, 100, 200, 100)
    </script>
  </body>
</html>